In almost any area of life, a person from time to time is faced with the fact that certain obstacles and problems arise on his way. But it is not always possible to determine the true cause of the appearance of a particular problem, and it itself can only be a visible consequence of something that is hidden from our attention somewhere inside ourselves or the activity in which we are engaged. And in order to understand the main causes of problems and eliminate them, it is very convenient to resort to the use of a technique developed specifically for this purpose - the diagram of Kaoru Ishikawa, a professor at the University of Tokyo and a leading specialist in quality management. This diagram is also known as Root Cause Analysis Diagram, Cause and Effect Diagram, and Fishbone Diagram. The presented lesson is dedicated to describing this method as a useful tool in any work and everyday life.
Ishikawa diagram and its author
This tool for analyzing the logical connections between various factors and the result was developed by Kaoru Ishikawa, a professor at the University of Tokyo, in 1952 (according to other sources in 1943). Ishikawa is known primarily as one of the founders of the Japanese school of management and the Japanese quality system.
For example, he argued that if a process change produces a consistently positive outcome, the process should be accepted as standard and not deviated from until the next process improvement cycle has occurred. When it occurs, you need to test the new version of the process again in practice, re-establish it as a standard and comply with it.
We invite you to familiarize yourself with the seminar “Diagnostics of problems and development of an organization on your own”
Kaoru Ishikawa also developed and introduced into production practice the concept of quality circles, and also developed a graphical diagram of cause-and-effect relationships. This method was called “Ishikawa diagram” by the name of the developer, and by its characteristic appearance “fishbone” or “fishbone”.
Ishikawa diagram example in an enterprise or production
An example of an Ishikawa diagram in production. For example, the defect rate in the workshop has increased by 13% over the past month.
Let's draw a diagram.
For this example, let's take 4 main positions:
- People;
- Method;
- Tools;
- Car.
Here I will not describe every detail, but for general understanding - the problems heard during brainstorming.
People - machines work around the clock, a shift worker suddenly fell ill, and the second one is on vacation. They hired an inexperienced “green” worker. The person did not work on this machine. There is an atmosphere of mistrust in the shop between shifts; each shift locks its tools under lock and key. There is no agreement between shifts.
Machine - gap 0.2 millimeters tolerance. Allows parts to dangle. An experienced worker knows this part of the conveyor and automatically places the part “as it should.” Marriage varies within normal limits. The new employee didn't know this. There is no regular inspection of machines.
Material – during the communication, a flaw in the warehouse workers was discovered that did not in any way affect this issue. But that could come back to haunt us with more serious problems in the future. We placed an order for a large batch of blanks from a new supplier. And from the very beginning they are no longer suitable in quality for production tasks.
Method – at this production there are no clear work standards and a bonus system that is incomprehensible to employees.
Solutions:
- Train a young specialist;
- The second is to protect against the “fool” - adjust the gap to a minimum, invite an adjuster;
- Apply the 5 S system (you can read more here)
- Set up equipment;
- Create a schedule for checking machines;
- Carry out debugging for preventive purposes throughout the workshop;
- Make trial batches from new suppliers;
- Change the supplier urgently and try to negotiate a return;
- Prepare work standards on your own or invite a consultant;
- Communicate KPI principles to all employees.
As you understand, this list of solutions is not limited to, and there will be more branches on the cause-and-effect diagram.
In some cases, it is necessary to supplement the branches of the fish skeleton with even more bones. For example, as was the case when optimizing processes in a bank.
Ishikawa Diagram - Possibilities
The Ishikawa diagram allows you to clarify and take into account all the significant factors influencing the result of any activity. This result could be a product, service, completed work, equipment condition, or problem—any object of study or development. The use of the Ishikawa diagram allows you to find out the causes of any problems in the organization or, for example, the causes of defects in products.
The Ishikawa diagram has advantages:
- helps to clearly show the connections between the result obtained and the reasons that caused it;
- allows you to analyze the chain of factors affecting the problem.
This has made the Ishikawa diagram a fairly popular analysis tool, especially in a quality management system, when it is necessary to understand exactly what reasons lead to a positive or undesirable result.
Advantages
- involvement of competent experts in the work of the group;
- application of structured analysis;
- consideration of all probable assumptions and hypotheses;
- graphical display of results in an easy-to-read form;
- identifying areas where additional data is needed;
- the ability to identify factors that may cause the event in question for both favorable and undesirable outcomes. A positive outlook on a problem can encourage greater responsibility and involvement among participants;
- the results can be used as input to FMEA or FTA.
Stages of working with the Ishikawa diagram
Working with the Ishikawa diagram can be divided into several main stages:
- Determining all the causes and factors that influence the result of interest
- Systematization of these factors and causes into cause-and-effect and semantic sections
- Assessment and prioritization of factors and causes within sections
- Analysis of the resulting structure
- Identification and elimination of factors and causes that cannot be influenced
- Omission of unimportant causes and factors
In order to more accurately determine the factors and causes that have the greatest impact on the result under study, it is recommended to use the brainstorming method, which is based on stimulating creative activity and involves offering as many options as possible. Typically, a diagram is drawn on a board or piece of paper, and then the main causes and their features are identified. The graph should be completed until the entire diagram is filled with cause-and-effect relationships. Once this stage is completed, you should move on to identifying the underlying or root cause.
Constructing an Ishikawa diagram, as you can see, is a rather complicated process and has a number of features that need to be mentioned separately.
Example
To make it clearer, our example in the form of an Ishikawa diagram:
If you are guided by the algorithm for the complexity that has arisen from a different angle, more comprehensively, objectively, and also see the whole chain of events that influenced its occurrence. But this method also has disadvantages, which may well lead to analysis errors.
Firstly, it is almost impossible to check the diagram by building a logical chain of facts from the root cause to the consequences. That is the other way around. And, secondly, the fragmentation of information, which in large volumes significantly complicates the perception of the whole picture. Agree, it’s difficult to focus when there are a lot of branches (bones) and blocks.
Features of constructing an Ishikawa diagram
First : before you start building a graph, you need to clearly define the formulation of the problem under consideration. If, for example, there are several participants in discussing an issue, then they should all come to the same opinion, and only after that start building a diagram.
Second : for ease of perception, the problem under consideration is best placed (written down) on the right side of the board or sheet of paper, and to the left of it, draw the “fish backbone” horizontally.
Third : the main causes influencing the problem are the “big bones of the fish skeleton”. They need to be framed and connected to the “ridge” with inclined arrows.
Fourth : then secondary causes are plotted on the diagram, which influence the main ones, which are their consequences. These are already “medium bones”, which are adjacent to the “large bones”.
Fifth : “small bones” are applied, adjacent to the “middle ones” - these are tertiary causes that affect the secondary ones. If any of the reasons are not identified, then the “bone” remains empty, i.e. The reason is not recorded, but space should be left for it.
Sixth : when analyzing a diagram, absolutely everything, even seemingly insignificant, reasons and factors should be taken into account. This is done in order to find the root cause and find the most effective way to solve the problem under study.
Seventh : causes and factors must be assessed according to their significance, i.e. it is necessary to find and highlight the most important of them - those that have the greatest impact on the problem under consideration.
Eighth : it is advisable to include in the diagram all the information related to the problem: names of causes and factors, dates, days of the week, names of participants in the process, names of products (if this is a production issue), etc. and so on.
Ninth : it is important to remember that the process of searching, analyzing and interpreting causes and factors is fundamental in creating a holistic structure of the problem and moving to specific actions.
Tenth : when identifying each new cause or factor, you should ask yourself the question “why”, because Thanks to this, it is possible to find the root cause that affects the problem as a whole.
By following these principles, you will be able to consider the problem most objectively and gradually reveal the entire chain of cause-and-effect relationships and find those factors that will need to be adjusted in order to achieve a solution to the problem and obtain the desired result.
Based on the above, one can identify the obvious advantages of the Ishikawa diagram. They, in turn, are, firstly, the opportunity to reveal one’s (and other participants’) creative potential, which will allow one to find extraordinary ways to solve the problem. And, secondly, the ability to find the relationship between all the causes and factors influencing the problem and assess their impact on it.
However, Ishikawa’s method also has its drawbacks, which must also be taken into account in your work. The first disadvantage is that there are no rules for checking the diagram backwards from the root cause to the results, i.e. it is not possible to consider the logical chain of causes and factors leading to the root cause. The second drawback is that the ultimately compiled diagram can be expressed in a very complex diagram and lack a clear structure, which greatly complicates an objective analysis and excludes the possibility of drawing the most correct conclusions.
Therefore, when approaching the issue of finding the causes of emerging problems and their solutions, it is important to use not only the Ishikawa diagram, but supplement it with other tools, among which are list making and prioritization, Vilfredo Pareto’s principle, Abraham Maslow’s efficiency pyramid, checklists and maps, as well as other effective methods for checking, analyzing and improving the effectiveness of actions. But all this concerns the most complex problems and issues, the solution of which must be approached in the most comprehensive manner.
If the problem implies a simpler way to find its solution, then the Ishikawa diagram will be quite sufficient, because it allows you to structure in an extremely clear and accessible form all possible causes of this problem, identify the most significant of them, find the root cause, and then correct or eliminate it . For many people, Ishikawa’s cause-and-effect diagram is the “golden key” to overcoming the huge number of obstacles that arise on the way to achieving success.
Dear subscribers and readers, we always welcome your ratings and comments! We invite you to take part in a short survey:
Theoretical part
A cause and effect diagram is used, as a rule, when analyzing defects that lead to the greatest losses.
It allows you to identify the causes of such defects and focus on eliminating these causes. In this case, four main causal factors are analyzed: man, machine (equipment), material and method of work.
When analyzing factors, secondary and perhaps tertiary causes are identified that lead to defects and must be eliminated. Therefore, to analyze defects and construct a diagram, it is necessary to determine the maximum number of reasons that may be related to the defects.
It consists of a quality indicator characterizing the result and factor indicators (Fig. 1).
Fig.1. Cause-Result Diagram Structure
Such a diagram in the form of a “fish skeleton” was proposed by the Japanese scientist K. Ishikawa. It is also called the “branching diagram of characteristic factors”, and sometimes the “four M” diagram - based on the composition of the four main factors: Man, Method, Material, Machine. The diagram reveals the relationship between indicators and the factors affecting them. First, a problem or quality defect is formulated. This is the "fish head". The four main factors of analysis are the “large bones of the skeleton.” For each factor, probable causes of defects are plotted on the diagram - these are “edges”, i.e. “medium” and “small bones of the fish skeleton” (Fig. 2).
Fig.2. Ishikawa diagram.
Constructing diagrams includes the following steps:
Stage 1.
The quality indicator is determined, i.e. the result that needs to be achieved.
Stage 2.
The selected quality indicator is placed in the middle of the right edge of a blank sheet of paper. A straight line (“ridge”) is drawn from left to right, and the indicator is enclosed in a rectangle. Below are the main reasons that affect the quality indicator. They are enclosed in rectangles and connected to the “ridge” by arrows in the form of “big bones of the spine” (the main reasons).
Stage 3.
Write down (secondary) causes that influence the main causes (“big bones”). They are located in the form of “middle bones” adjacent to the “big bones”. Tertiary causes that influence secondary causes are recorded. They are arranged in the form of “small bones” adjacent to the “medium ones”.
Stage 4.
Reasons (factors) are ranked by their importance using a Pareto chart. Particularly important reasons are identified that presumably have the greatest impact on the quality indicator.
Stage 5.
All the necessary information is included on the diagram: title; name of the product, process or group of processes; names of participants in the process; date, etc.
The principle of constructing the diagram is shown in Fig. 3.
Rice. 3. The principle of constructing an Ishikawa diagram.
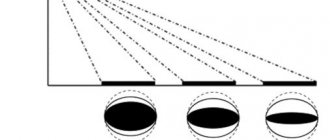
When structuring a diagram at the level of primary arrows of factors in many real situations, you can use the “five M” rule proposed by Ishikawa himself. It consists in the fact that in general there are the following five possible reasons for certain results: materials, machines, technology (methods), measurements, people. All these words in English begin with the letter “M”: Material, Machine, Method, Measurement, Man, which is where the name of this rule comes from. In Fig. Figure 4 shows the result of a group of 5 people determining the relative importance of the factors causing a loudspeaker speaker to fail to meet the quality standard.
Rice. 4. Ishikawa scheme with estimates of the significance of factors.
The diagram shows the most significant factors in accordance with the number of concentric rings on the factor arrows. They are: the consistency of the glue (4 rings), the deformation of the damper (3 rings) and the carelessness of the assemblers (3 rings).
In Fig. Table 5 shows, as an example, the most important possible reasons that influence the result of consumer dissatisfaction (consequences).
Fig.5. Cause-and-effect diagram to identify causes of customer dissatisfaction.
As examples in Fig. 6 and 7 show Ishikawa diagrams for monitoring product quality and the quality of specialist training.
Rice. 6. Factors affecting product quality.
The system of factors for quality education at a university can be represented using the Ishikawa diagram (Fig. 7).
Fig.7. Factors that most influence the quality of specialist training
How to build an Ishikawa diagram in Excel
It is quite difficult to construct an Ishikawa diagram using Excel. But you can analyze the weight of each factor. And based on the schedule, find the optimal way to solve the problem.
Let's look at our example. The found factors do not have a numerical expression. For illustration, let's evaluate them in points.
Let's sort the numbers in ascending order. Let's calculate the share of each factor with a cumulative total.
Let's illustrate the scores in the form of a histogram. And the share is in the form of a graph with markers.
The diagram shows that in order to solve the problem that has arisen, you need to work mainly with the first three factors.
Apply layout to make the diagram clear and readable
Use fonts to make your diagram easy to read. Canva's tool gives you access to thousands of free, coordinating fonts. Try using a bold font such as Raleway to highlight the main problem, and print the reasons and details of the problem in a less bold font such as Open Sans Light.
Additionally, you can change the text color, background, and element design to suit your brand. If you're a Canva Pro subscriber, you can add your own fonts and apply them to any design for a professional look.
Graphic rules
When drawing a fishbone diagram, large first-order arrows are attached to the main horizontal arrow, which depicts our object of analysis, which indicate root factors or groups of factors that influence the object. Arrows of the first order are followed by arrows of the second, and arrows of the third, and so on, until all the factors influencing the object or situation are taken into account.
Moreover, each subsequent arrow in relation to the arrow of the previous order is a cause, and each subsequent one is a consequence.
The size of the picture and its shape are absolutely not important. The main thing is to correctly distribute the subordination and mutual dependence of factors.
Moreover, the clearer the fishbone is, the better the diagram looks and reads.
The Five M's Rule
Despite the apparent simplicity of construction, Ishikawa’s “fish bone” requires a thorough knowledge of the object of analysis from the performers, a clear understanding of the mutual dependence and influence of factors on each other.
To facilitate the construction of such a scheme, you can use the rule of five “M”, which was proposed by its author. It lies in the fact that when analyzing many real situations, the primary (root) causes are the following:
- Man (people) - reasons that are associated with the human factor.
- Machines (machines or equipment).
- Materials - reasons related to resources or materials.
- Methods (methods, technologies) - reasons associated with the organization of processes.
- Measurements (measurements or finances).
This is why the Ishikawa diagram is sometimes called the “5M analysis diagram.”
Preface
In 1953, Tokyo University professor Kaoru Ishikawa, discussing a quality problem in a factory, summarized the engineers' opinions in the form of a cause-and-effect diagram. Over time, the diagram began to be used in practice, and it turned out to be very useful and eventually became widespread in many companies in Japan. Subsequently included in the Japanese Industrial Standard (JIS) for quality control terminology, it is defined as follows: cause-effect diagram - a diagram that shows the relationship between a quality indicator and the factors affecting it. The diagram was named after Kaoru Ishikawa, who made invaluable contributions to the development of industry and economics in Japan. There are two transcriptions of the professor's surname: Ishikawa and Ishikawa
. Ishikawa in Russian pronunciation is Ishikawa. (L.G. Golubkova presentation “Management schemes in the organization”)
Brainstorming tool
So let's start building a fishbone diagram.
Take a large sheet of paper or board. On the right side in the middle we write the problem and draw a horizontal line from it. We write down the reasons that affect the problem and draw segments connecting them to the main line. Let's start working on the second order arrows.
The same cause may appear in different branches of the diagram. Eliminating it will lead to solving several problems at once.
And the relationship between factors and causes is clearly demonstrated by the hierarchy of arrows.
It is this “fish bone” that is an excellent tool for teamwork or brainstorming. At the same time, the attention of the participants is concentrated not on complaints and regrets, but on specific constructive proposals to eliminate the reasons that led to the current situation.
Solve problems easily with clearly laid out diagrams
An Ishikawa diagram is usually drawn from right to left. Choose one of the ready-made templates and customize it. Start with the head, identifying the main problem, and move along the body, adding reasons and possible solutions.
You can add branches as you build the diagram. Simply click on one of the lines or arrows, then click the Copy button on the toolbar, or simply hold down Cmd/Ctrl+C and Cmd/Ctrl+V to copy and paste as many lines as you need. You can even color code each cause and its ramifications. Simply click on an element or text field, then use the color wheel in the toolbar to select the shade you want.
The main principles of working with the circuit
When compiling and analyzing an Ishikawa diagram, it is important to adhere to the following rules:
- It is necessary to take into account everything, even the most insignificant factors and problems. Only in this way does it become possible to find the root cause of the situation, and therefore to find the most effective solution to it.
- During the analysis, it is important to evaluate factors according to their significance. Thus, the root factors are identified - those that influence the situation the most.
- By entering the most complete information into the diagram (names of reasons, dates, names of participants, names of products), the situation or problem becomes clear and visual.
- Important! The process of search and analysis, interpretation of problems and factors is a fundamental part in creating a holistic picture and those specific actions or directions of movement that can solve a problem or resolve a situation.
Compilation method
The main goal is to have three to six main factors that cover all possible influences. Based on the results of constructing the Ishikawa/Ishikawa diagram, the depth of such a tree reaches four or five levels. The depth of the levels allows you to visually assess the picture of all possible root causes of a particular problem. If there is difficulty with the main branches, then standard headers can be used:
Staff (people)
include factors determined by the condition and capabilities of a person. For example, this is a person’s qualifications, his physical condition, experience, etc.
Working Method (Technology)
includes the manner in which work is performed, as well as everything related to the productivity and accuracy of the performed operations of the process or activity.
Mechanisms
– these are all factors that are determined by the equipment, machines, devices used in performing actions. For example, the condition of the tool, the condition of the devices, etc.
Materials
- these are all the factors that determine the properties of the material in the process of performing work. For example, the thermal conductivity of the material, viscosity or hardness of the material.
Control
– these are all factors influencing the reliable recognition of errors in the execution of actions.
External environment (environment)–
These are all factors that determine the influence of the external environment on the performance of actions. For example, temperature, light, humidity, etc.
Description of the method
An Ishikawa diagram is a graphical way of exploring and identifying the most significant cause-and-effect relationships between factors and consequences in the situation or problem being studied. The diagram is named after one of the leading Japanese management theorists, Professor Kaoru Ishikawa (石川馨, romaji Kaoru Ishikawa
), who proposed it in 1952 (according to other sources - in 1943) as an addition to existing methods of logical analysis and improving the quality of processes in Japanese industry.
Ishikawa is one of the developers of a new concept of production organization, embodied in. The scheme proposed by Professor Ishikawa clearly shows the work to improve the quality of production processes. It, like most quality tools, is a means of visualizing and organizing knowledge that systematically facilitates the understanding and eventual diagnosis of a particular problem.
Such a diagram allows you to identify key relationships between various factors and more accurately understand the process under study. The diagram helps to identify the main factors that have the most significant impact on the development of the problem under consideration, as well as to prevent or eliminate the effects of these factors.
The scheme is widely used in the development of new products in order to identify potential factors whose action causes an overall effect.
An example of a cause-and-effect diagram showing 2 levels of bones.
The appearance of the diagram when viewing the field of the problem under study really resembles the skeleton of a fish (the eyes usually move from left to right, as when reading a line of text). The problem is indicated by a main arrow. Factors that aggravate the problem are shown with arrows tilted to the main right, and those that neutralize the problem are shown with arrows tilted to the left. As the level of analysis deepens, arrows of factors influencing them can be added to the arrows of second-order factors, etc. The figure shows such an example with two levels of bones: the 1st level is indicated in red - the main (radical): a, b, c ,d
, and blue 2nd level - in-depth (detailed) causes (factors)
of the studied influence on the result
(among the factors of the 2nd level are those that enhance the effect of the 1st level -
e, f, g, h, i, l, m, o, p
, and those that weaken it -
k, n
). Next, the separation of the detected factors is deepened according to their increasing specificity until the branches of the problem are subject to an additional section (in this case, it is necessary to identify the true causes, not the symptoms).
The key is to have three to six main categories that cover all possible influences. In fact, the maximum depth of such a tree reaches four or five levels. When such a diagram is created, it provides a fairly complete picture of all possible root causes for a particular problem.
The Ishikawa diagram is used as an analytical tool for viewing the action of possible factors and highlighting the most important causes, the action of which gives rise to specific consequences and can be controlled (see the materials of the seminar “Issues of standardization, accreditation and quality”).
Working with the Ishikawa diagram is carried out in several stages:
- Identification and collection of all factors and causes that in any way influence the result under study
. - Grouping of factors into semantic and cause-and-effect blocks
. - Ranking of these factors within each block
. - Analysis of the resulting picture
. - " Releasing
"
factors that we cannot influence
. - Ignoring minor and unimportant factors
.
To more effectively identify and add possible causes to the main ones, as well as to more specifically detail the possible root causes of the branches of the “main bone,” a method of stimulating the generation of creative ideas known as “brainstorming” is traditionally used. A typical application of this method is for a team leader to draw a diagram on a whiteboard, who first identifies the main problems and asks for help from a group of employees to identify the root causes, which are schematically indicated on the main bone of the diagram, and detail them. The group provides suggestions until eventually the entire cause-and-effect diagram is completed. Once the discussion is complete, it is decided what the most likely root cause of the problem is.
Rules
1) determine the goal;
2) all team members participate in the discussion;
3) it is recommended to exclude fruitless conversations, valuing ideas and conscious handling of facts;
4) there must be teamwork in the development of any thoughts expressed to team members;
5) participants should not feel afraid to express their ideas;
6) criticism is not allowed, all ideas are written down, not a single idea is immediately rejected;
7) proposals are not limited only to factors related to the speaker’s activities;
team members should be encouraged to unleash their creative potential;
9) management personnel are not recommended to speak out first;
Example of a finished diagram
Let's try to understand the principle of constructing an Ishikawa diagram using an example. The key problem, and therefore the title of the diagram, will be as follows: “Defects of finished products at the enterprise.”
- First, we define the main problem, which will become the name of the “ridge” of the scheme. So, the basis of the diagram is called “Defects of finished products”.
- We determine the primary factors that are the cause of this problem; they will serve as the names of the blocks for the “bones” of our scheme. The main reasons for the appearance of defects in an enterprise include: equipment, personnel, environment, work technology and materials.
- Now let's move from the general to the specific. Smaller causes of problems should be included in each block. Under the “bone” with the name “Equipment” we write all the problems associated with it, for example, outdated machines, breakdowns, etc. In the “Personnel” section we write: unskilled workers, stressful situations, insufficient motivation, etc. The block under The title “Technology” may include the following problematic facts: incorrect order of work, insufficient fastening force, etc. We work according to this principle with each section.
- After the entire diagram is constructed, every factor, even the smallest one, will be before your eyes, based on it, a “brainstorming” begins, the logical conclusion of which is the solution to the dominant problem.
Place problematic factors according to their degree of significance, i.e. the main ones closer to the ridge, gradually moving away. This way, it will be clearly visible which problem is worth thinking about first, and which points can be put into the background.
Features of the method
The Ishikawa diagram, like any phenomenon in human life, has its positive and negative qualities. Before you start working, you need to get to know them.
Positive points
- Diagramming promotes creative thinking.
- A non-standard approach to solving a problem is much more interesting and productive.
- The Ishikawa type of diagram allows you to arrange various phenomena according to their degree of importance, which provides a clear opportunity to notice in which direction you should move.
- This method allows you to trace the internal relationship of each problem and its causes.
- The main positive aspect is visibility, which always simplifies the process of establishing relationships and speeds up the search for solutions.
- In order to carry out this technique with subordinate personnel, it is not at all necessary to look for highly qualified employees; even the most mediocre employee can cope with this task.
Negative points
- Often the scheme turns out to be very difficult, which significantly slows down the search for solutions to problems.
- Unfortunately, it is not possible to check the diagram in the opposite direction, i.e. the logic behind the appearance of problematic facts is not visible.
- This method, like any other, allows for errors in drawing up the diagram. No one is immune from the inclusion of incorrect conclusions and factors in the structure. In this case, there can be only one solution: be more attentive to the discussion, look at each proposal from a critical point of view.
As you can see, there are much more positive aspects than negative ones, which is why the Ishikawa diagram technique is quite popular these days.
The Ishikawa diagram can be used not only to solve production problems; recently, psychologists have increasingly begun to use this technique.
Unique ways of solving problems help a person to dig deeper into himself and get to the roots of the problems. This method is excellent for solving family problems; in this case, the spouses will together look for the causes of troubles and ways to solve them.
This kind of work in itself brings people together, in addition to helping to eradicate the problem at the root.
Reverse brainstorming
"Reverse Brainstorming"
Shadow Brainstorm
Action plan
- Announce the order of presentations to the participants.
- Clearly formulate the problem and present it in a form that is most convenient for the participants.
- Listen to each participant about ways to solve the problem (stage – “Promotion of ideas”).
- Select 2-3 ideas for development.
- Criticism of selected ideas (stage – “Criticism of ideas”).
- Protection and development of ideas that have been criticized (stage – “Protection of ideas”).
- The manager's choice of proposals that will help better solve the problem.
- Implementation of solutions.
Rules for the meeting
- Everyone should speak out on the issue.
- The order of performances is from “cabin” to “captain”, from junior to senior.
- Only the “captain” asks questions.
- Criticize ideas and defend them only after the “captain’s” command.
- Everyone should criticize and then defend the selected ideas.
- The result of the work is summed up by the “captain”
Advantages and disadvantages
Information sources:
- Bush G.Ya. Basic heuristics for inventors. - Riga: Knowledge, 1977.
- Gilde W., Starke K.D. Need ideas. - M.: Mir, 1973. MMK.
Focal object method
Action plan
- From the conditions of the task, select the object (prototype) to be improved (FO), and clarify the goal.
- Select 3-4 random objects (by opening a catalog, book, etc. at random).
- Write down several characteristic features (properties) for each of them.
- Transfer the obtained features to the prototype (focal object) and obtain new combinations.
- Develop new combinations through free associations. Record all interesting ideas.
- Evaluate new ideas and select the most effective in terms of implementation. Formulate tasks for the development of new modifications of the object.
Advantages
- Ease of learning and unlimited possibilities for finding new approaches to the problem.
- Unconventionality of the ideas put forward.
- The versatility of the method.
Flaws
- Unsuitable for solving complex problems.
- MFO and all its varieties provide only simple combinations.
- Lack of selection rules and internal criteria for evaluating the ideas received.
Example of application of MFO
Improved object Random objects Characteristic properties or signs of random objects
- Glasses: sunglasses, protective, fashionable.
- Felt boots: warm, soft, rustic.
- Parachute: drop-down, colored, reliable.
New combinations
- Solar flashlight, protective flashlight, fashionable flashlight.
- The flashlight is warm, the flashlight is soft, the flashlight is rustic.
- A drop-down flashlight, a colored flashlight, a reliable flashlight.
New ideas
- Solar rechargeable flashlight, electric shock flashlight, decoration flashlight.
- Flashlight plus heater, flashlight in the form of a soft toy, flashlight-beacon for pets.
- Folding flashlight, flashlight with color filters, shockproof flashlight.
Information sources:
- Altshuller G.S., Zlotin B.L. et al. Search for new ideas: from insight to technology (Theory and practice of solving inventive problems). - Chisinau: Cartea Moldovenasca, 1989.
- Technical creativity: theory, methodology, practice. Encyclopedic dictionary-reference book. / Ed. A. I. Polovinkina, V. V. Popova. M.: NPO "Inform-System", 1995.
Classification of causes that form the “skeleton” of the diagram
The Ishikawa diagram consists of a central vertical arrow, which actually represents the effect, and large “edges” approaching it, which are called first-order causes. Smaller arrows, called second-order causes, approach these “edges,” and even smaller arrows approach them, called third-order causes. Such “branching” can take a very long time, up to nth order reasons.
Using the brainstorming method to create a diagram
In order to build an Ishikawa diagram, you must first discuss with your team the existing problem and what the most important factors influence it.
The method of brainstorming or brainstorming assumes that not only employees of a certain enterprise participate in the discussion, but other persons can also take part, since they have an “open eye” and approach solving the problem from an unexpected angle.
If during the first stage of discussion it is not possible to reach a consensus on the causes causing a certain effect, then as many stages as necessary are carried out to identify the main factors.
During the discussion, no ideas are discarded; all of them are carefully recorded and processed.
Flaws
- the expert group may not have the necessary competence;
- the correct choice of primary and secondary causes depends on the experience of the group;
- to develop recommendations, the method should be used only as part of a root cause analysis;
- the method is intended for brainstorming, not independent analysis;
- dividing causal factors into major categories at the beginning of the analysis means that relationships between causal categories may not be adequately considered, such as equipment failure caused by operator error or operator error caused by system design flaws;
- there are no quantitative studies;
- The method does not apply to multiple consequences.